
Key points
– Australian unlisted commercial property returns have been very strong over the last two decades thanks largely to the “search for attractive yields” by investors.
– With the back up in bond yields, this driver is reversing leaving retail and particularly office property vulnerable to significant capital loss in the face of reduced space demand.
– Key to watch will be bond yields, whether the economy avoids recession and where “work from home” settles.
Introduction
Over the last 10 and 20 years, returns from Australian unlisted commercial property have averaged 9% pa. This in part reflected the search for decent income bearing investments by investors in response to falling interest rates & bond yields that pushed up property values faster than justified by rents. However, it’s now vulnerable from the rise in bond yields over the last two years and reduced space demand flowing from “work from home” for office property and online retail for retail property.
Commercial property and the investment cycle
Just as shares lead in the investment cycle, unlisted assets like commercial property, being more connected to the real economy, tend to lag. The next chart is a stylised version of the investment cycle – the thick grey line is the economic cycle. (Note that residential property has become more interest sensitive and now tends to move ahead of commercial property.)
The investment cycle
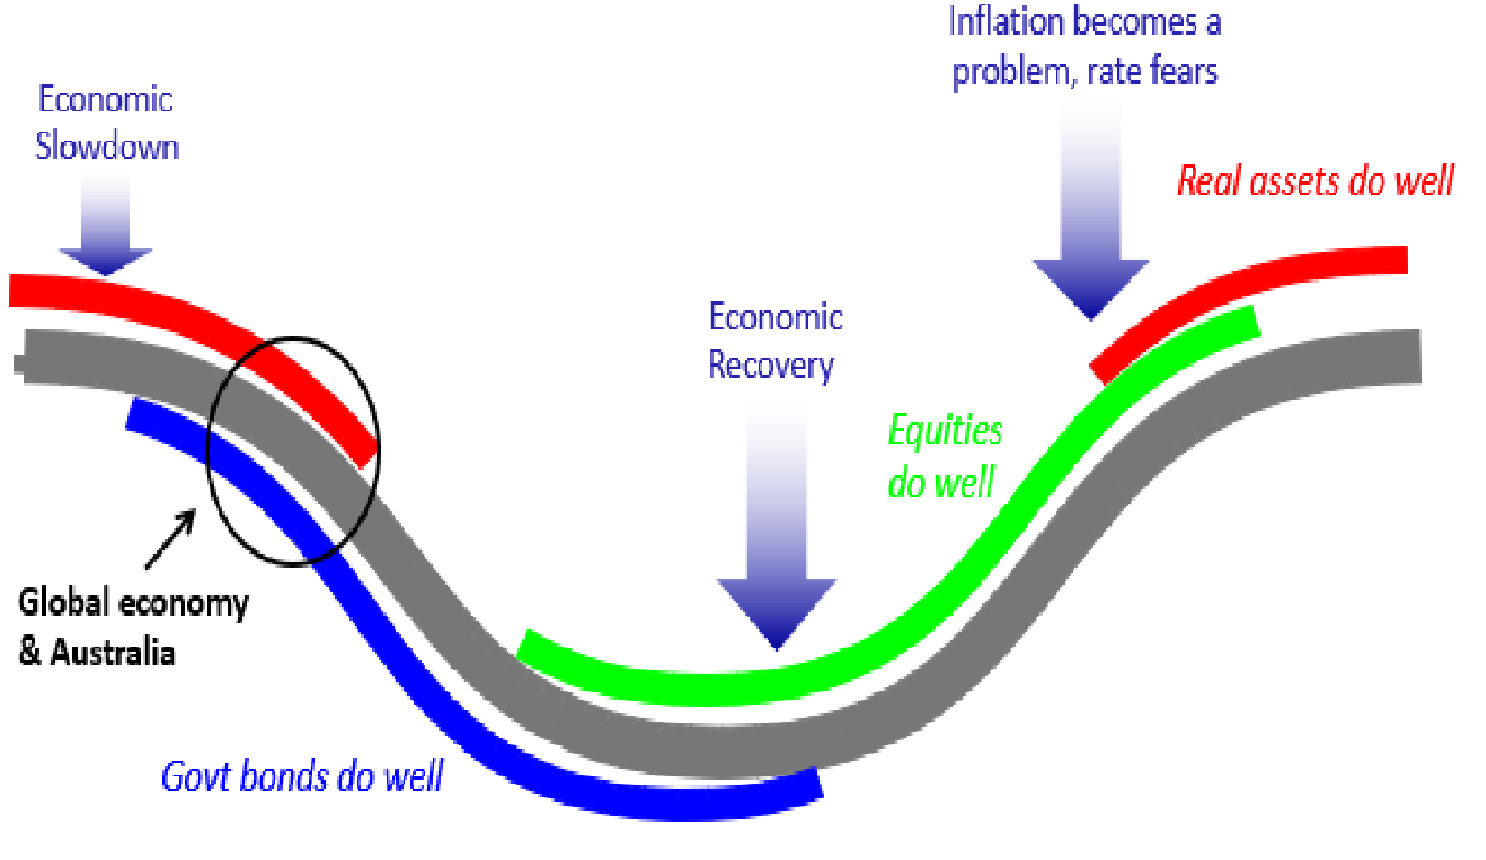
Source: AMP
Bonds do well in the economic downturn phase as interest rates fall and when inflation is still falling. Shares tend to lead the economic recovery as they respond first to easy money and as far-sighted investors sniff out recovery and continue doing well as profits rise before coming under pressure from eventual interest rate hikes & fears of a new downturn. Real assets tend to do relatively well later in the cycle as: it takes longer for easy money to flow into them; the valuation process results in a lag; & they tend to move more with current economic conditions which drives rents. This benefitted unlisted commercial property returns in 2021-22. However, the investment cycle is now turning against commercial property with interest rates up sharply and economic growth slowing. The slump last year and ongoing volatility in share markets has at least partly anticipated this with commercial property starting to follow with a lag.
A-REITs show the way…with a lot of noise!
This cyclical relationship can also be seen by comparing the returns from Australian Real Estate Investment Trusts (A-REITs) and directly held (ie, unlisted) non-residential property returns. The former are correlated with the share market. This makes them highly volatile but means they often provide a good lead for unlisted commercial property. Their weakness since January last year signals rougher times ahead for unlisted commercial property and returns have started to slow to reflect this.
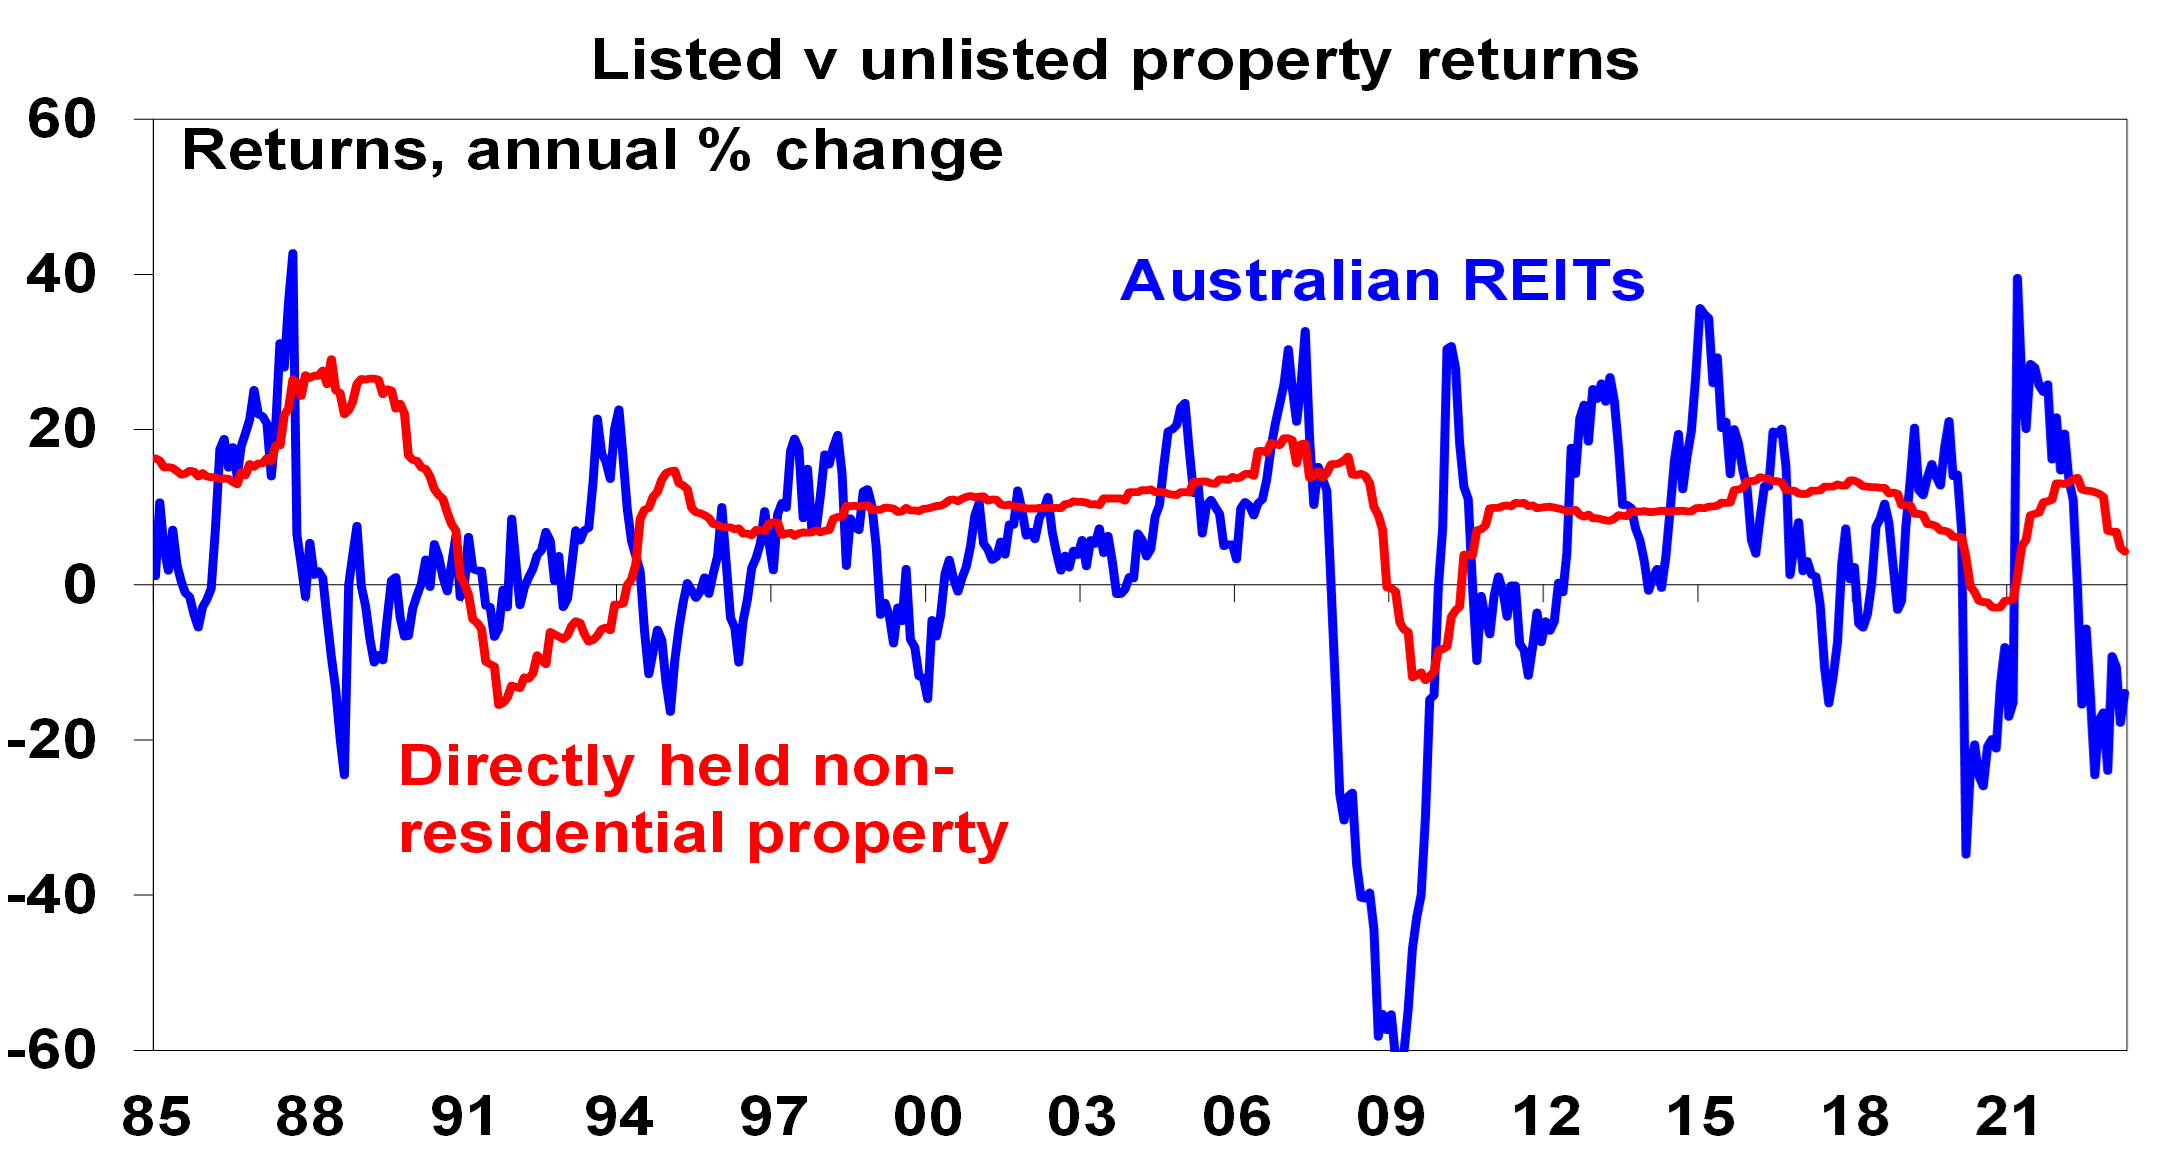
Source: Bloomberg, Mercer/IPD, AMP
The “search for yield”
Commercial property is arguably more vulnerable now because it benefitted from the decades long downtrend in interest rates and bond yields that may now have come to an end or be reversing. As interest rates and bond yields fell it drove a search by investors for decent income bearing investments – the “search for yield” – that pushed property values up faster than growth in rents and hence pushed property yields to record lows. The next chart shows yields for unlisted commercial property. With each 0.25% fall in property yields translating to a roughly 4% capital gain and with average commercial property yields having fallen from 7.3% to 4.89% between December 2009 to December 2019 this provided a huge boost to returns, averaging roughly 4.3% pa and pushing values nearly 50% higher over ten years. This is now starting to go in reverse.
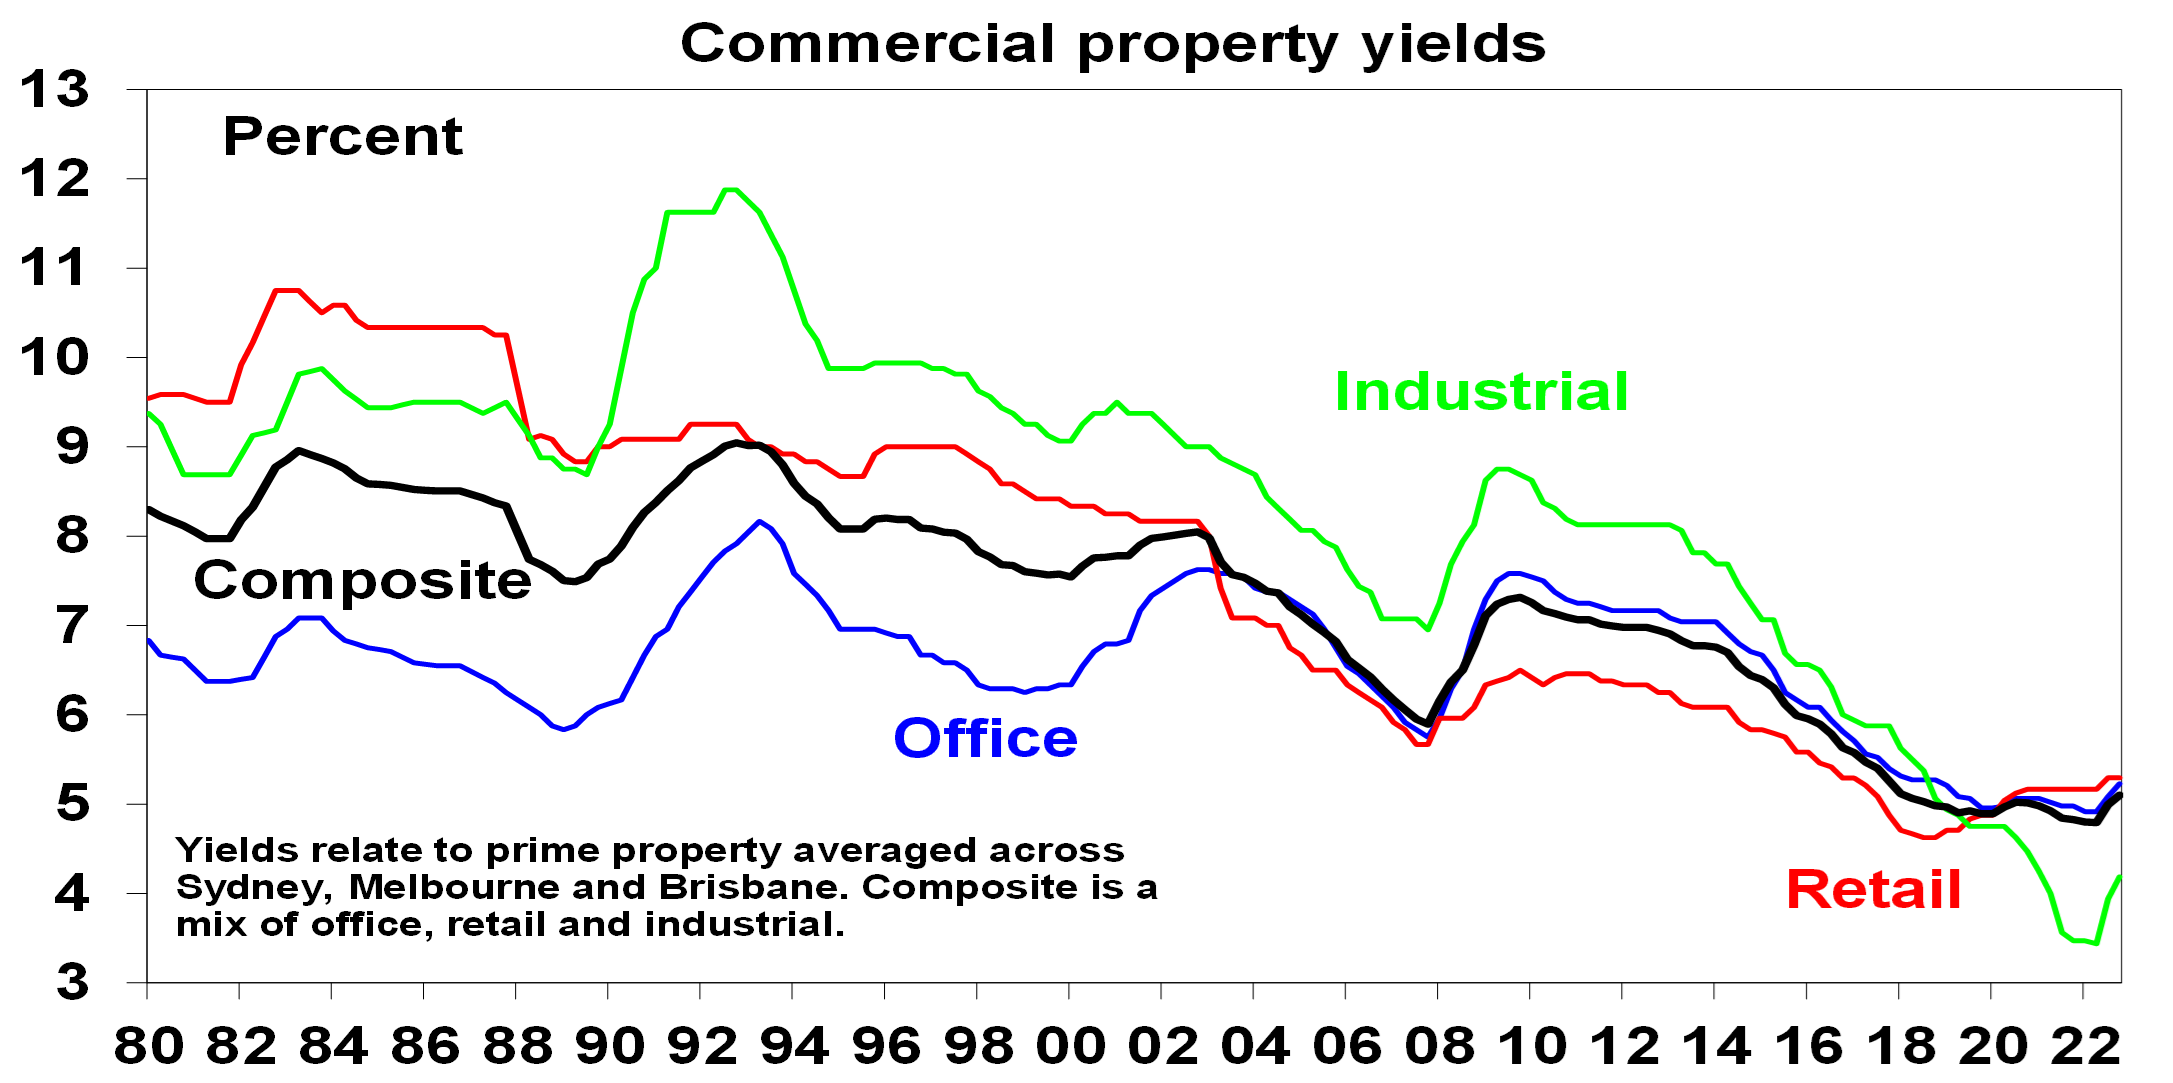
Source: JLL, AMP
Of course, while the decline in yields since the 1980s was big, unlisted non-residential property was not alone. In fact, while the grossed-up dividend yield from shares has been range bound over the last 40 years, yields on bonds, residential property and listed property have fallen more than unlisted commercial property yields. See the next chart. 10-year bond yields have fallen from well above commercial property yields in the 1980s to well below. And in the 1980s the rental yield on residential and commercial property was similar, but today the former is far lower.
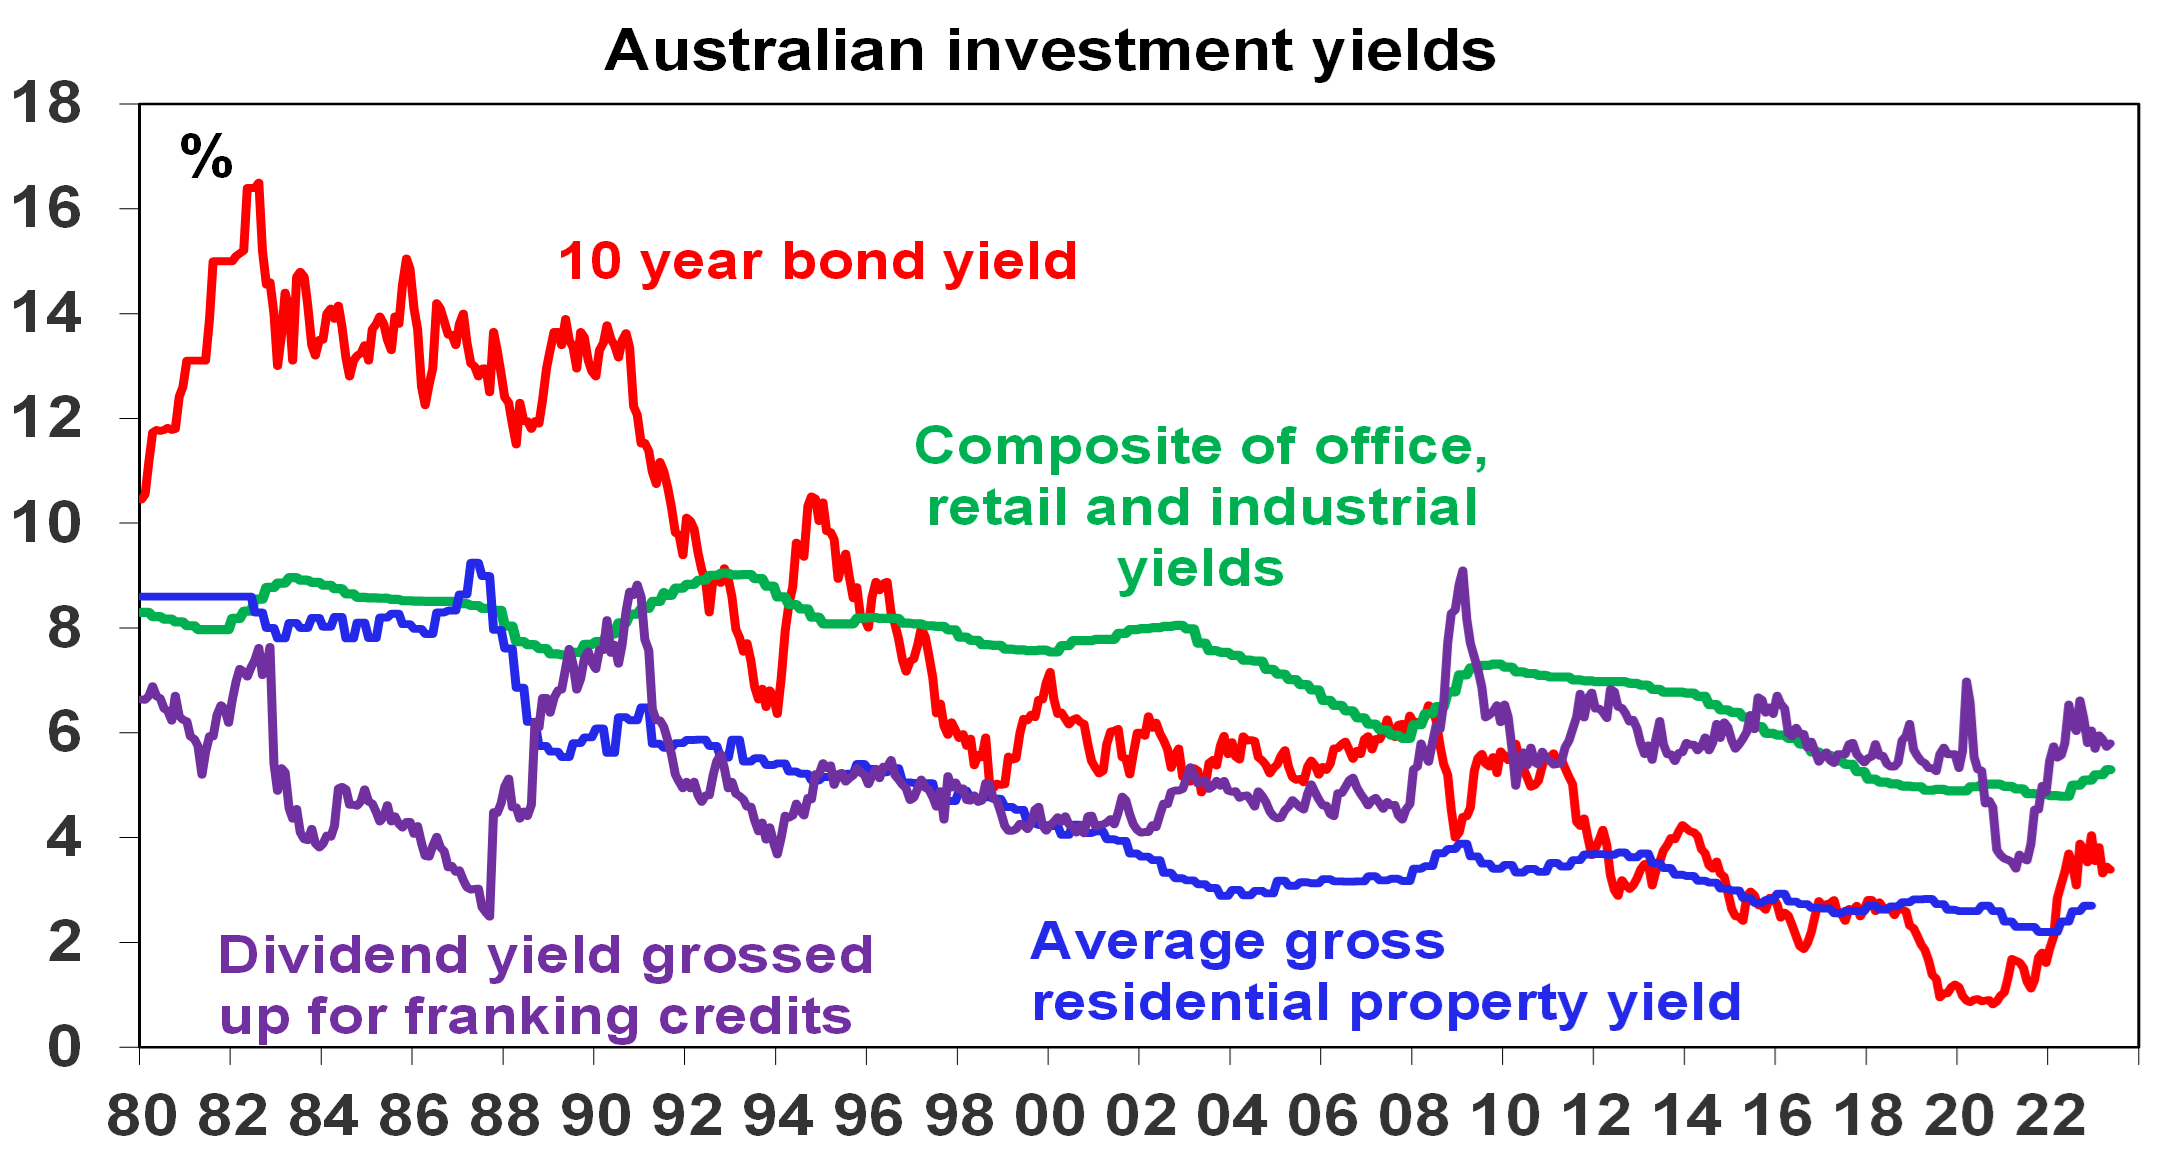
Source: JLL, REIA, Bloomberg, AMP
The commercial property risk premium – is it enough?
This suggests that while unlisted commercial property is vulnerable to an ongoing back up in yields other assets are arguably even more vulnerable. But there is a catch as commercial property is facing an oversupply problem in office and retail whereas the other asset classes are not, eg, Australian housing is facing chronic shortages as immigration surges.
But first to get a better handle on the relative attractiveness of unlisted commercial property compared to bonds we calculate a property risk premium. Comparing the bond yield with the average property yield is not strictly correct as the former is a nominal yield while the latter is a real yield. So, a better comparison is to look at the risk premium offered by commercial property over bonds. The next chart shows a proxy for this.
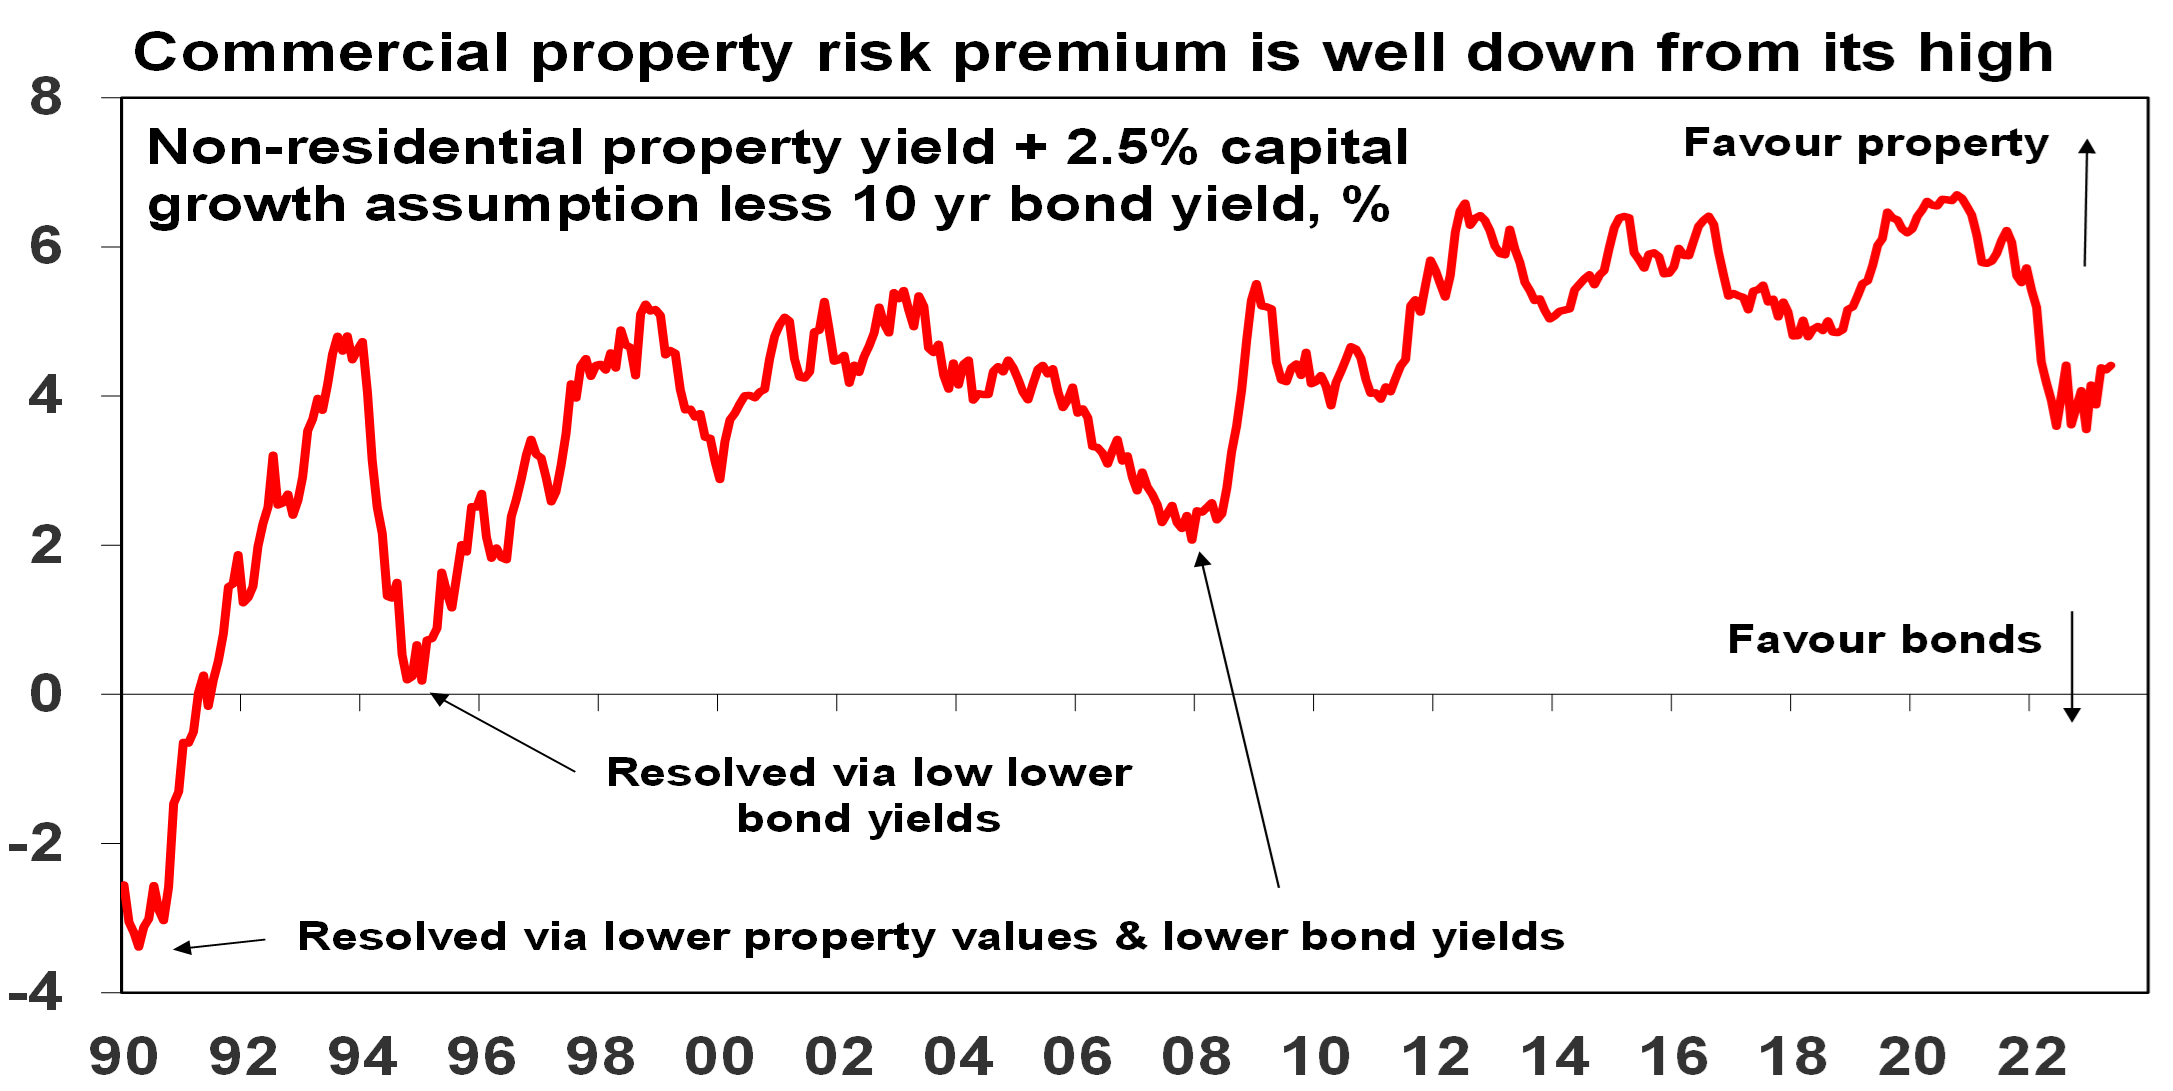
Source: JLL, Bloomberg, AMP
It assumes that rental and capital growth will average 2.5% pa over time (ie, in line with targeted inflation) and adds this to the average unlisted non-residential property yield to give a guide to potential total returns. The 10-year bond yield has been subtracted to show a property risk premium. Despite the collapse in property yields in late 2020 it reached a record high of more than 6.7% thanks to plunging bond yields at the time below 1%. Since then, the rise in bond yields has seen the risk premium plunge to levels not seen since the 2000s, but at around 4% it’s still relatively high. But there are two threats here. The first is if bond yields continue to rise reversing the yield chasing investor flows that commercial property has benefitted from over many years. And even if bond yields don’t rise further there is a risk that the reduced property risk premium may not be enough to keep investors happy given the outlook for deteriorating leasing conditions ahead.
Work from home and space demand
Leasing conditions typically deteriorate when the economic cycle turns down as companies lay off workers & cut hiring, retail spending slows and economic activity slows generally impacting industrial property. This time around it could be made worse by structural considerations in the case of retail and particularly office property. Retail property has been adjusting for years to the rising proportion of activity which is transacted online. The share of retail sales online has gone from around 7% pre-pandemic to around 11% now and this is acting to constrain retail space demand and rents. While there has been a return to the office post the pandemic lockdowns, many office employees are averaging two days a week in the office with Mondays and Fridays often near deserted. There are huge benefits to working together physically around culture, collaboration, idea generation and learning from others but there are also benefits to working from home in terms of no wasted commute time, more focussed work, less damage to the environment, better family flexibility and life balance. Once the pandemic revealed these benefits, they can’t then be unseen. And cost focussed companies with hot desking, laptops and work anywhere IT have pushed their staff in that direction anyway. The ideal for most is probably somewhere in between the extremes at say 2-3 days a week in the office but a return to the pre-pandemic norm of 4-5 days is most unlikely. This means that many companies will likely give up space when their leases expire, as they accept that balanced work from home is here to stay and they use it as a way to save rental costs. Over time this could mean a 30-40% reduction in leased office space demand. Average Australian capital city office vacancy rates are at 15% – their highest since the mid-1990s. But because this measures leased space, significant upside is possible if companies bite the bullet and cut leasing requirements. And rising vacancy rates mean lower office rents and falling values.
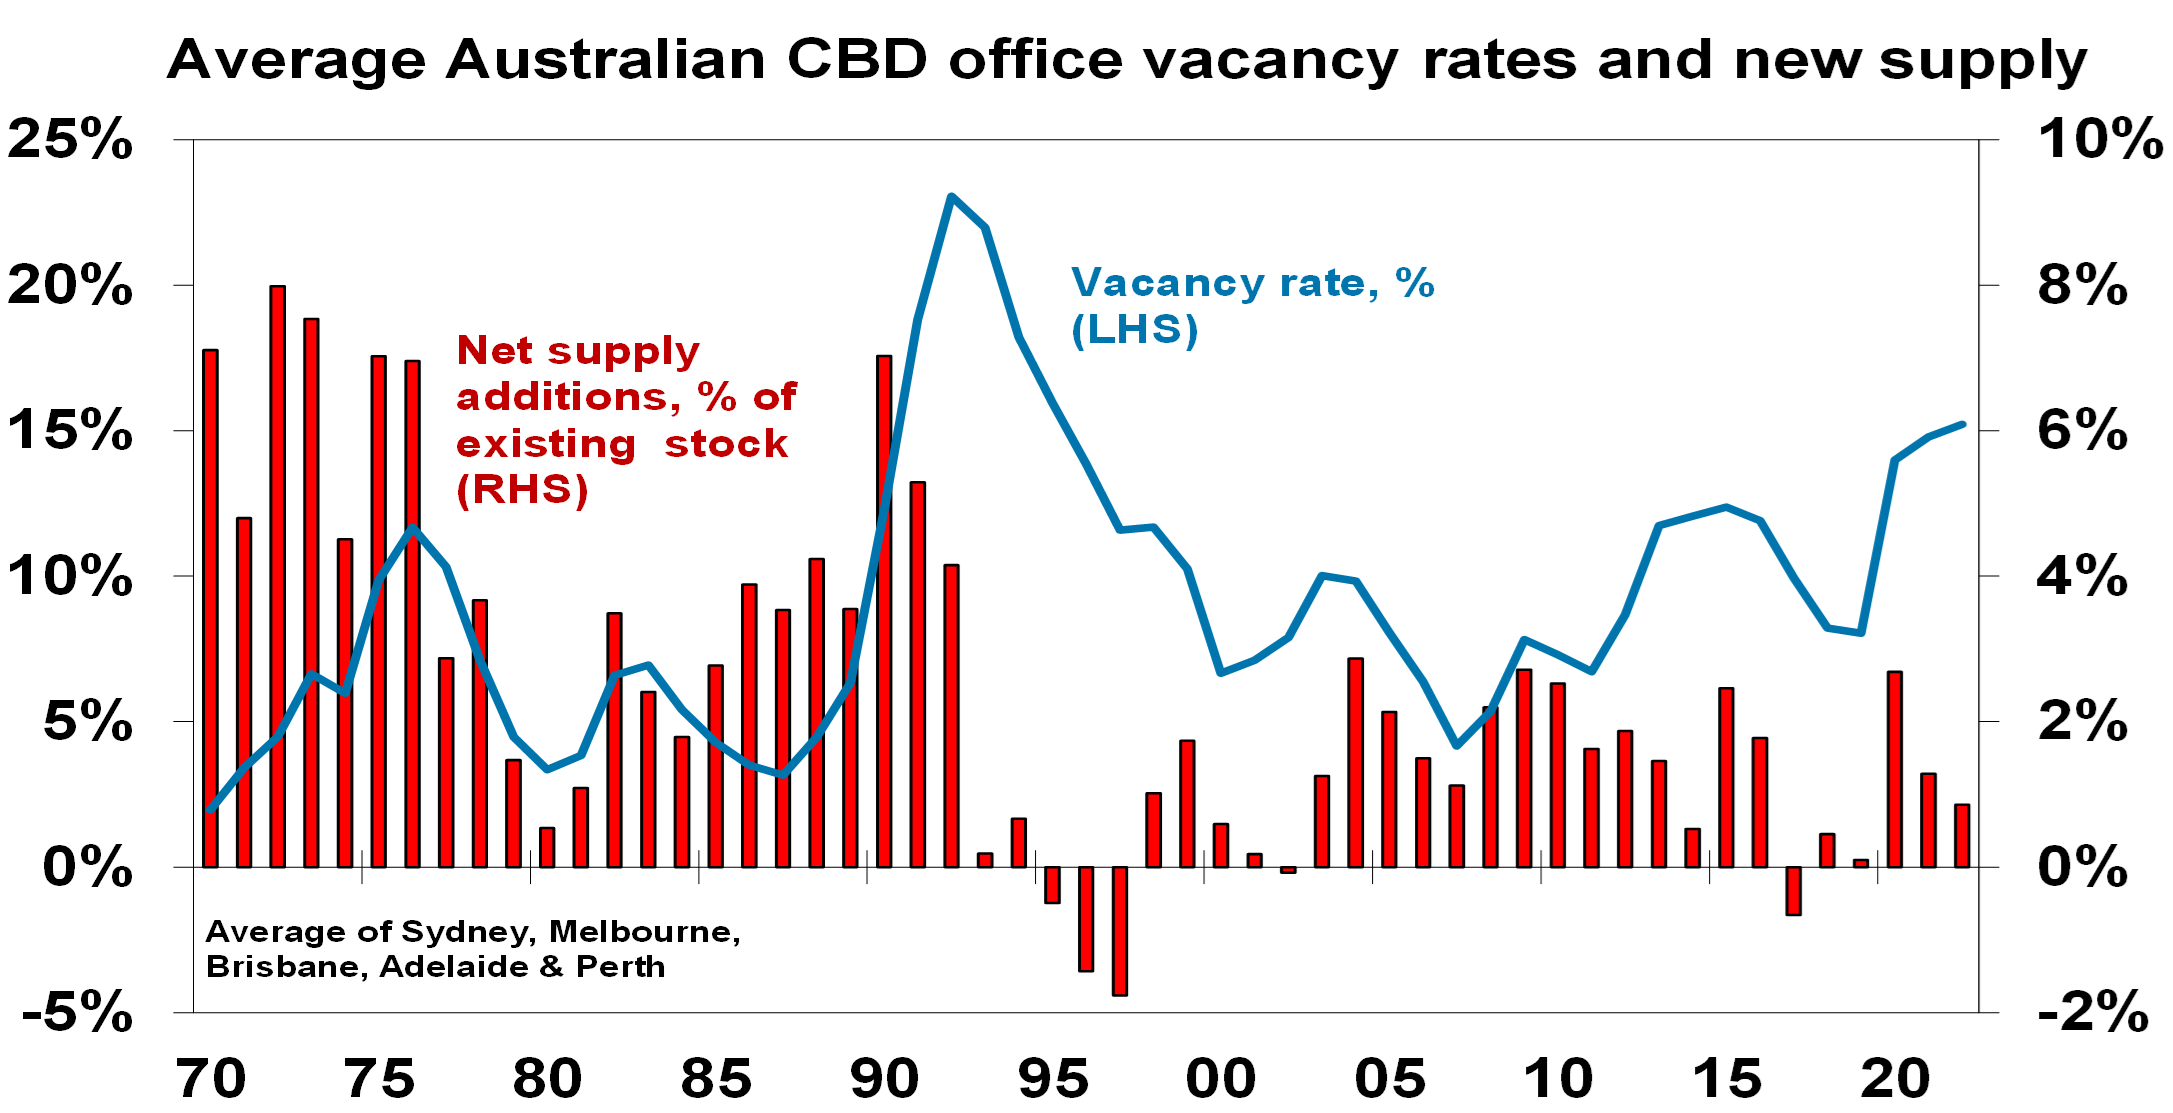
Source: AMP
Return outlook and what to watch?
The combination of the back up in bond yields resulting in a stalling if not reversal of “search for yield” demand for commercial property, slowing economic activity and structural threats to office and retail space demand leaves unlisted commercial property at risk of significant capital loss (15% plus) ahead. Industrial property has benefitted more from the plunge in bond yields but not does face the same structural threats to space demand as office and retail do so is better placed.
This risks a flow on to banks. Particularly in the US where commercial property loans make up about 40% of smaller banks lending and 13% of bigger banks lending at a time when property owners will be finding it harder to borrow with recent banking stress. In Australia, commercial property loans are only 6% of bank assets and lending is far more prudent suggesting less risk of a re-run of the damage to banks seen in the early 1990s property collapse. Key to watch will be bond yields, whether the economy avoids recession and where “work from home” settles.
What you need to know
While every care has been taken in the preparation of this article, neither National Mutual Funds Management Ltd (ABN 32 006 787 720, AFSL 234652) (NMFM), AMP Limited ABN 49 079 354 519 nor any other member of the AMP Group (AMP) makes any representations or warranties as to the accuracy or completeness of any statement in it including, without limitation, any forecasts. Past performance is not a reliable indicator of future performance. This document has been prepared for the purpose of providing general information, without taking account of any particular investor’s objectives, financial situation or needs. An investor should, before making any investment decisions, consider the appropriateness of the information in this document, and seek professional advice, having regard to the investor’s objectives, financial situation and needs. This article is solely for the use of the party to whom it is provided and must not be provided to any other person or entity without the express written consent AMP. This article is not intended for distribution or use in any jurisdiction where it would be contrary to applicable laws, regulations or directives and does not constitute a recommendation, offer, solicitation or invitation to invest.
The information on this page was current on the date the page was published. For up-to-date information, we refer you to the relevant product disclosure statement, target market determination and product updates available at amp.com.au.