
Investment markets and key developments
Global share markets had a strong week helped by a further fall in US inflation adding to expectations that the Fed is at or close to the top. For the week US shares rose 0.8%, Eurozone shares gained 1.7%, Japanese shares rose 3.5% but Chinese shares fell 0.8%. The positive global lead helped boost Australian shares which rose 2% for the week with gains led by material, IT, property and energy stocks. Bond yields rose as did oil, metal and iron ore prices. The “risk on” tone also saw the $A rise as the $US continued to fall.
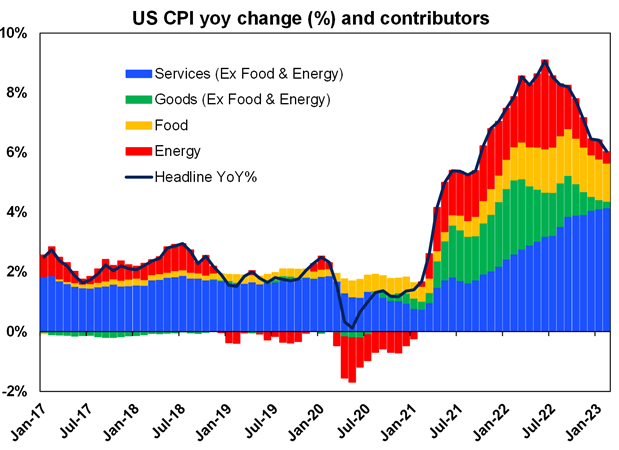
Inflation pressures are continuing to recede. This was evident in a further fall in US inflation and even Indian inflation falling to a 15-month low. US inflation fell to 5%yoy in March with a sharp slowing in annual energy and goods price inflation leaving it well down from its high of 9.1% in mid last year.
Source: Bloomberg, AMP
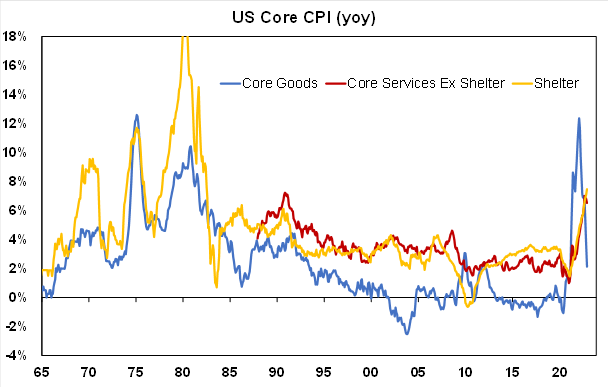
While US core (ie, ex food and energy) inflation remains sticky at 5.6%yoy due to high services inflation, core services inflation excluding shelter (a key focus of Fed Chair Powell) is starting to slow and shelter (or rent) inflation is also starting to slow with advertised rents pointing to a further slowdown ahead.
Source: Bloomberg, AMP
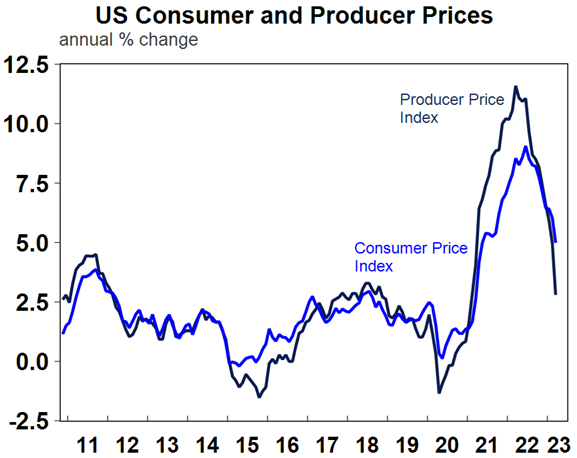
US producer price inflation slowed further in March to just 2.7%yoy and also points to a further fall in CPI inflation. In fact, both look to be falling just as fast as they went up! Of course, it never feels that way day to day and week to week given all the noise around inflation lately.
Source: Macrobond, AMP
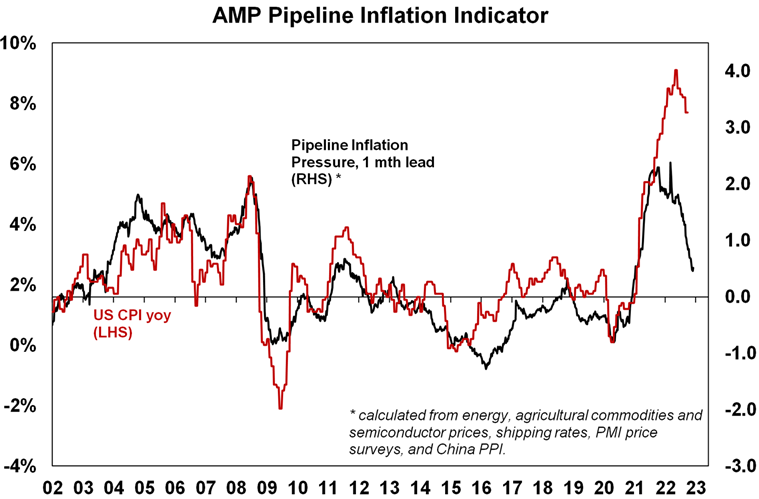
Our US Pipeline Inflation Indicator continues to point to lower US inflation ahead.
Source: Bloomberg, AMP
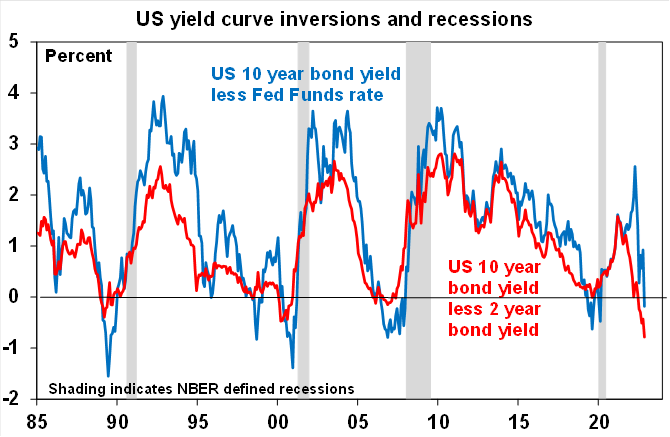
Yield curves continuing to point to a high risk of US recession – and that the Fed has probably done enough. A sharp fall in bond yields since February and still rising short term interest rates has seen US yield curves invert further (ie long term rates fall further below short term rates). Even the near term yield curve – which some at the Fed appear to prefer – as proxied by the gap between the 2 year bond yield and the Fed Funds rate – has now inverted. Over the last 50 years all US recessions have been preceded by inverted yield curves as is the case now – but the lag can be up to 18 months and it can give false signals. At the very least the plunge in 2 year bond yields below the Fed Funds rate is signalling that the market expects that the Fed has probably done enough to control inflation and that the Fed will cut rates over the next two years.
Source: Bloomberg, AMP
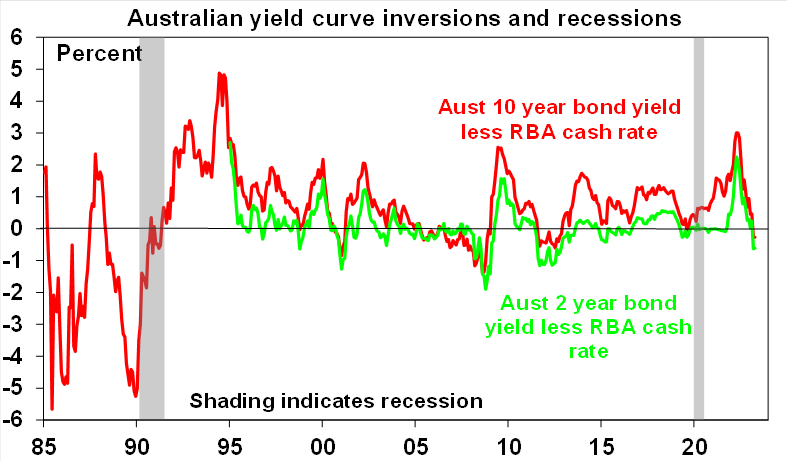
In Australia, the yield curve has also now inverted warning of a rising risk of recession – but its track record in signalling recession is poor. The decline in long term rates below the cash rate is signalling though that the money market expects that the RBA has probably also done enough to control inflation.
Source: Bloomberg, AMP
This is also now starting to be reflected in falling fixed mortgage rates in Australia as they price off longer term bond yields. That said fixed mortgage rates (with eg one major bank cutting its 3 year fixed rate to 5.59%) remain way above the 2% or so lows of two years ago and are still above many variable rates so their recent falls won’t ease the fixed rate reset or contribute to a new property upswing.
Central banks at or near the top:
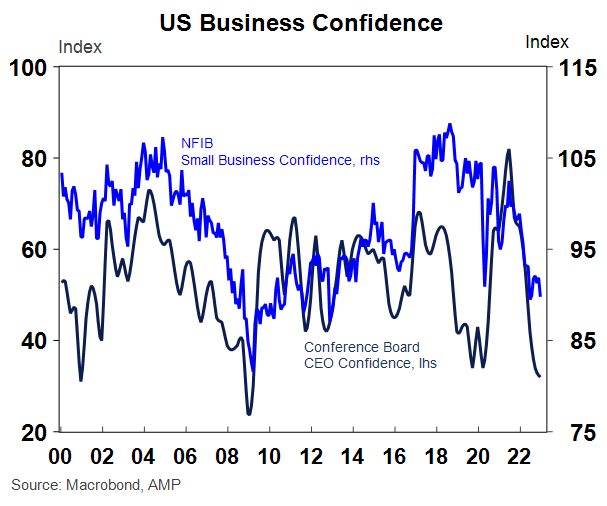
- The sticky core US inflation evident in March probably leans the Fed towards one last 0.25% rate hike at its May meeting and most Fed speakers appear to favour that. But with falling job openings, a mixed jobs report for March, falling job openings and the minutes from the last Fed meeting indicating that the Fed’s staff expect bank stress to contribute to a “mild recession” it’s a close call. In terms of the impact of banking stress – while Fed emergency funding to banks has slowed, the March NFIB small business survey showed a sharp increase in difficulty in obtaining loans which also takes pressure off the Fed for more rate hikes.
- The Bank of Canada, the Bank of Korea and Singapore’s Monetary Authority all left monetary policy on hold.
- In Australia, strong March jobs data adding to the risk of a wages breakout and the upswing in the residential property market (which if sustained would reverse the negative wealth effect from lower home prices) increase the risk of another RBA rate hike in May. Our base case is that with the labour market being a lagging indicator and economic growth and inflation likely to continue to slow the RBA will remain on hold at its May meeting. But it’s a close call with upcoming data on inflation to be watched closely.
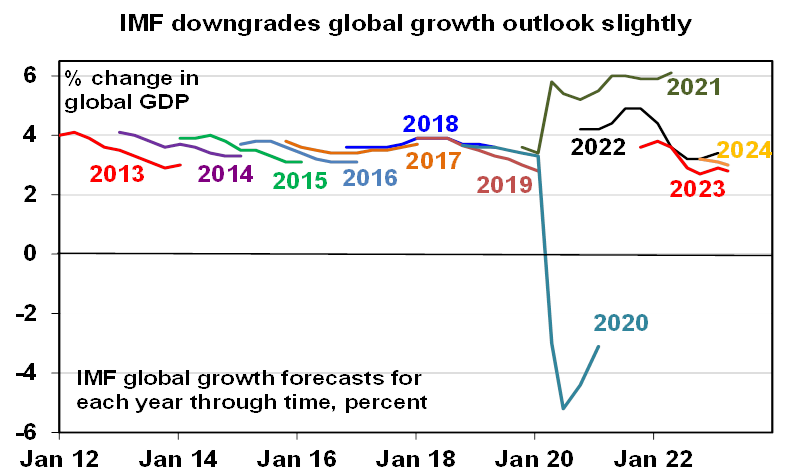
Underlying the soft global growth outlook the IMF revised down its global growth forecasts for this year and next citing the banking problems and sticky inflation, but the revisions were minor and were nothing new for investment markets. The IMF’s growth forecasts for 2023 and 2024 were both revised down – but only by 0.1% to 2.8% and 3% respectively which leaves them little changed from where they have been since mid last year and not way out of line with pre-pandemic average growth rates – see the next chart. The IMF sees inflation in advanced countries falling to 2.6% in 2024. While the IMF expects Australian growth to slow to 1.6% this year and 1.7% next year this is similar to RBA forecasts (and a bit stronger than our own) and is a bit stronger than its expectations for growth in other advanced countries. The good news for Australia is that the IMF expects China’s economy to growth 5.2% this year and 4.5% next year.
Source: AMP
Further signs of improvement in the Australia-China trade relationship after the restrictions and tariffs imposed on several products in 2020. Earlier this year coal exports resumed to China and its now reportedly reviewing tariffs on Australian barley – holding out hope for a removal of tariffs and restrictions affecting other products, like wine, timber, crustaceans & lamb. This would be good news for the producers affected. It also reduces the risk of restrictions on Australian services exports (mainly tourism and education) to China. But its overall macro impact would likely be minor as apart from coal the exports affected were a small part of Australia’s total exports, many of the industries diverted exports to other markets and Australia has been running near record trade surpluses anyway. It will be swamped by the impact of the removal of travel restrictions on Chinese students and tourists.
Economic activity trackers
Our Economic Activity Trackers rose slightly in the last week in the US and Australia but fell slightly in Europe. The basic picture is soft but there is still no sign of a collapse.
Levels are not really comparable across countries. Based on weekly data for eg job ads, restaurant bookings, confidence, credit & debit card transactions and hotel bookings. Source: AMP
Major global economic events and implications
US economic data showed a stronger than expected gain in industrial production, but another fall in retail sales, continued weak small business optimism with very weak capex plans and a continuing rising trend in jobless claims consistent with a weakening jobs market. Import prices are also now down 4.6%yoy.
Source: Macrobond, AMP
Eurozone industrial production rose a greater than expected 2%yoy in February.
New Bank of Japan Governor Ueda indicated the need to maintain easy monetary policy suggesting no rush to start monetary tightening. Meanwhile, consumer confidence and the Eco Watchers’ economic sentiment index both improved in March and producer price inflation slowed to 7.2%yoy in March from 8.3% in February.
Stronger growth/lower inflation in China. Chinese exports and imports surprised on the upside in March with a particularly strong rise in exports (reflecting a rapid reopening driven boost to the supply side and stronger global demand) and bank lending and credit growth was also much stronger than expected. At the same time headline CPI inflation fell to just 0.7%yoy, with core inflation also at 0.7%, and producer price inflation fell to -2.5%yoy.
Australian economic events and implications
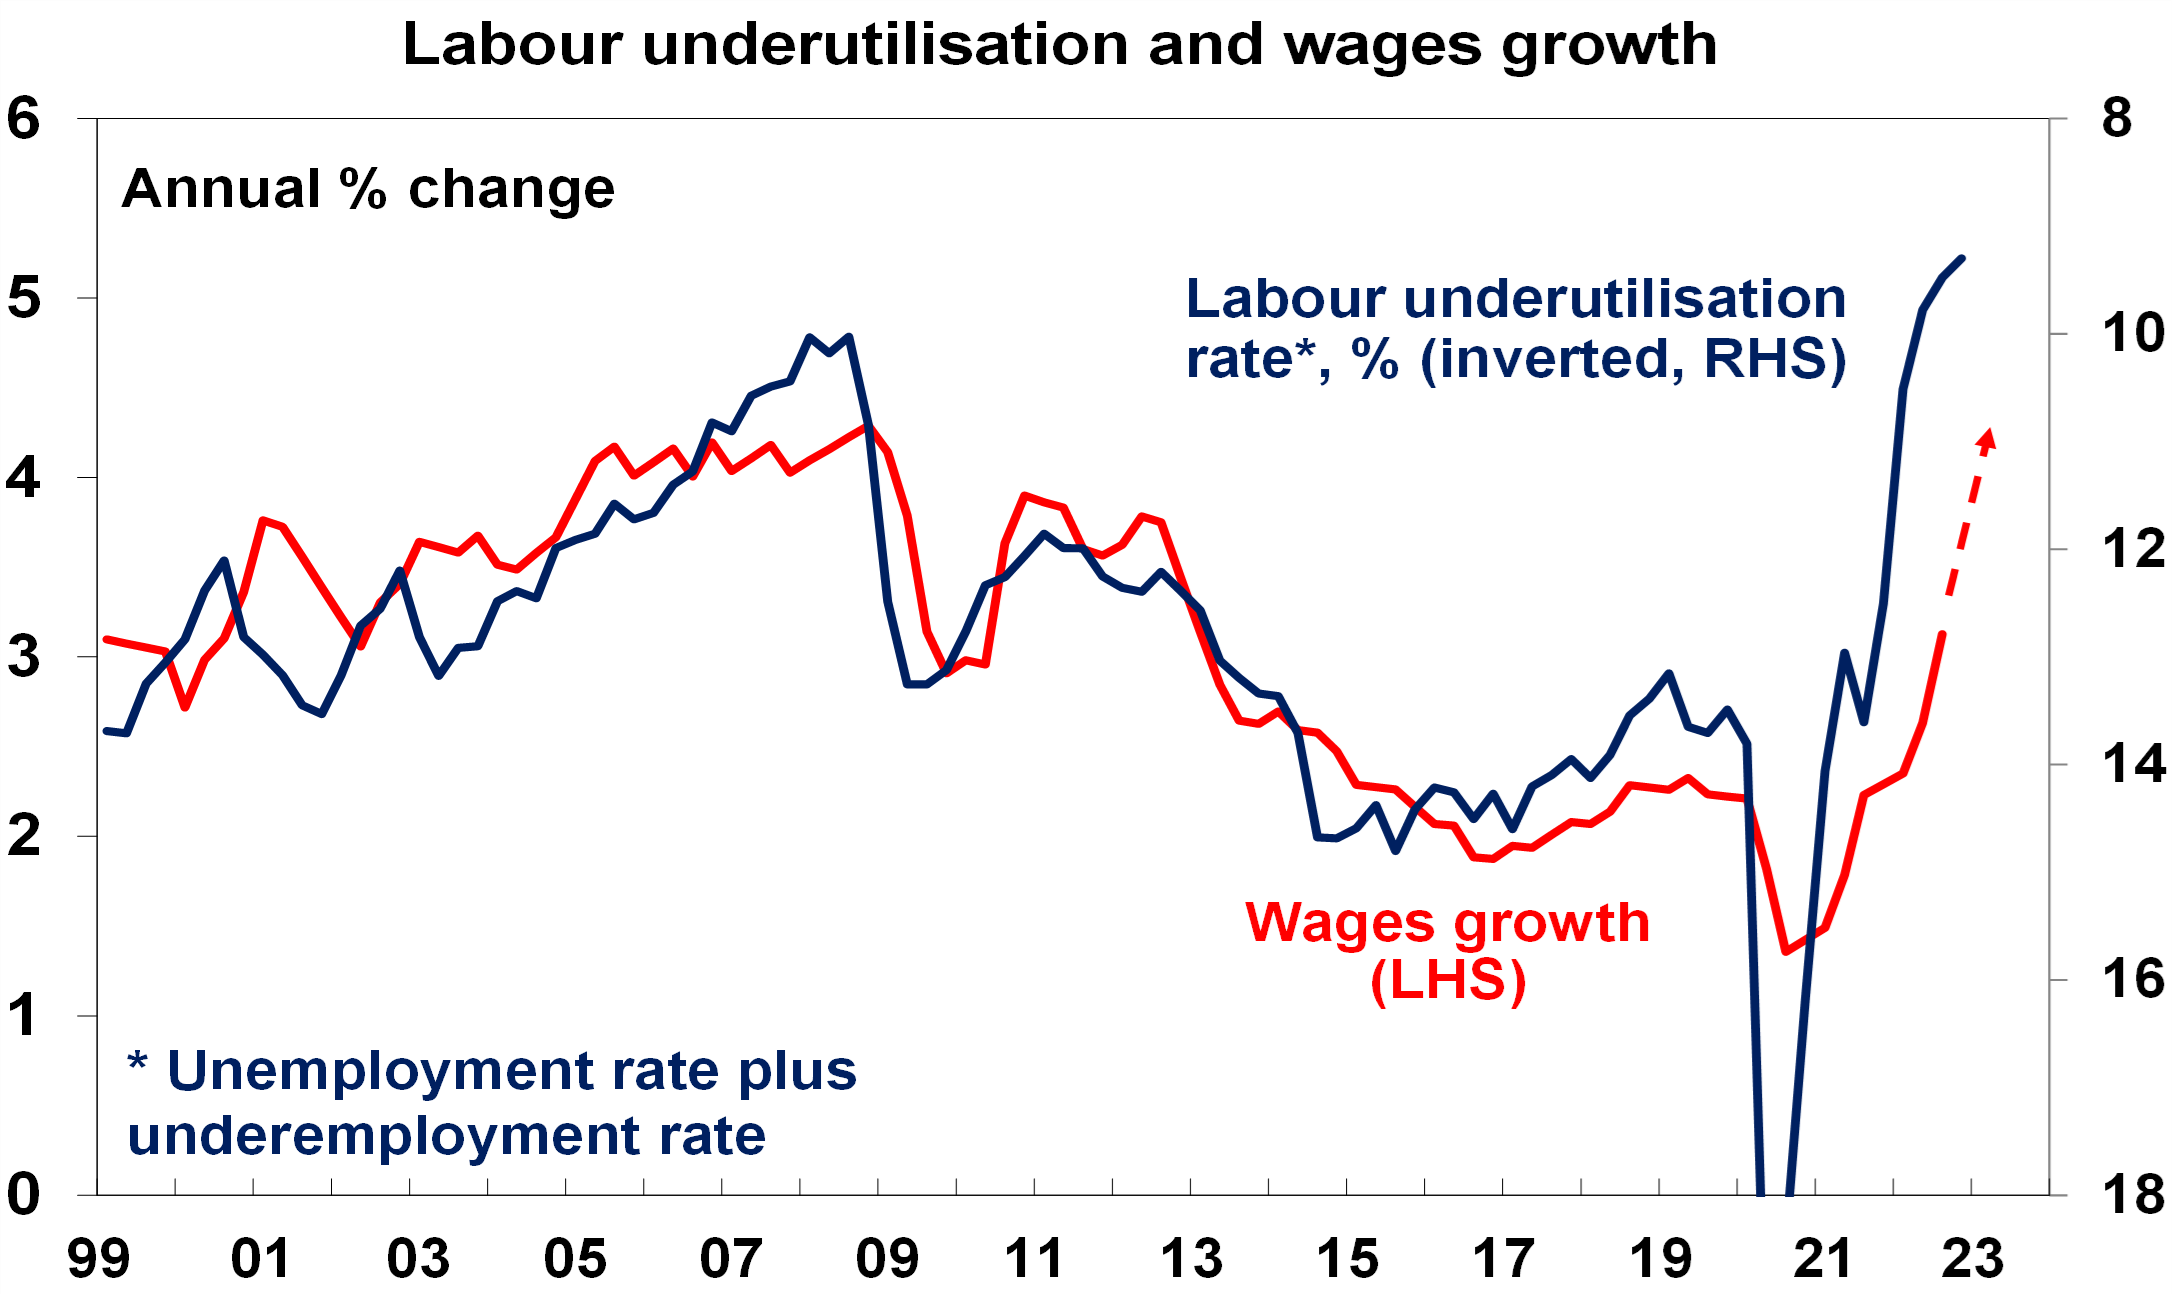
The Australian jobs market remained surprisingly strong in March. Employment rose by another 53,000, participation rose to a near record high, and unemployment was unchanged at 3.5%. Underemployment and labour underutilisation rose slightly though but the overall message is that jobs market remains tight and this runs the risk of a wages breakout. So far wages growth remains “three point something” which is consistent with the 2-3% inflation target but the continuing tight labour market, the lifting of public sector wage growth caps in NSW and Victoria and claims for a 7% increase in the minimum wage all point to upside risks for wages growth which will concern the RBA. So taken on its own the March jobs data adds to the case for another rate hike in May. However, the jobs market at least does not appear to be getting any tighter, it’s a lagging indicator and falling job openings and surging immigration point to a softer jobs market ahead. So, along with other signs of slowing growth and inflation, it makes more sense for the RBA to remain on hold which is our base case, but it’s a close call. The next round of inflation data will clearly be watched closely.
Source: ABS, AMP
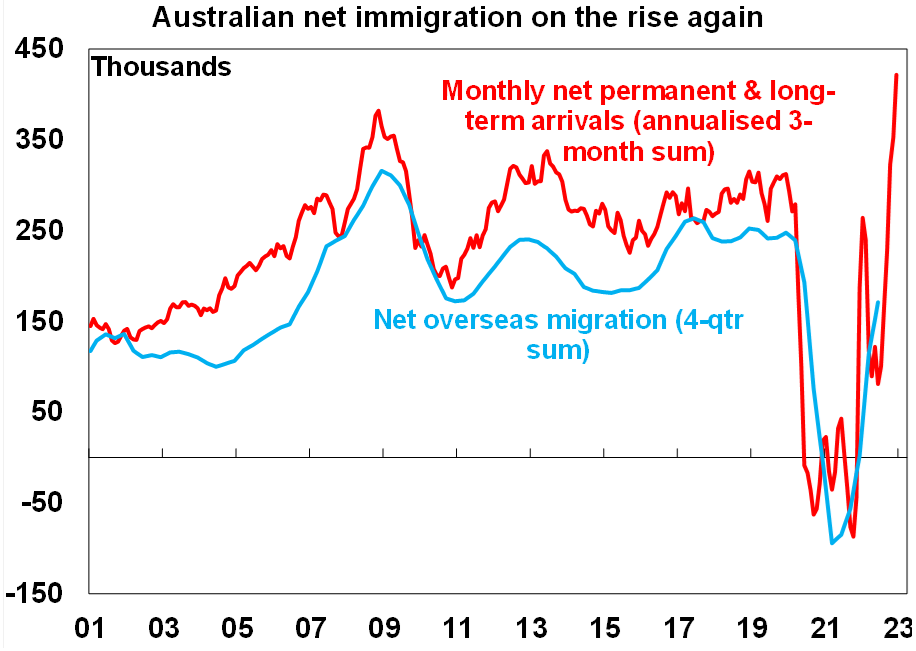
Immigration continuing to surge. February net permanent and long-term arrivals data points to a continuing surge in net immigration – this is good news in terms of easing labour shortages but bad news in terms of worsening the housing shortage.
Source: ABS, AMP
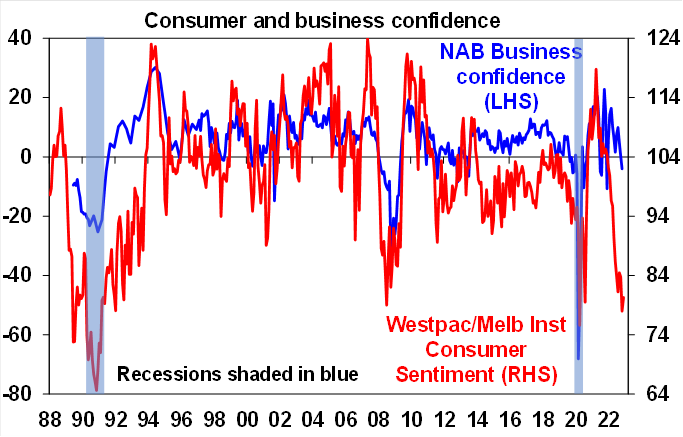
Meanwhile confidence improved a bit with consumer confidence up 9.4% in April after the RBA paused rate hikes but to a still very weak reading of 85.8pts. Business confidence rose slightly in March according to the NAB business survey but business conditions slowed slightly albeit remaining strong.
Source: Westpac/MI, NAB, AMP
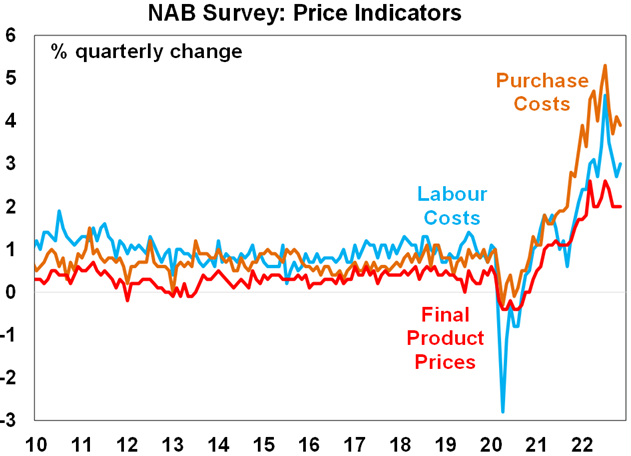
The March NAB survey showed a further fall in cost and price pressures – which are now all well down from their high last year.
Source: Westpac/MI, NAB, AMP
The April consumer survey showed mixed readings with respect to home buying with a sharp rise in home prices expectations but still weak responses to whether now is a good time to buy a dwelling (presumably reflecting high mortgage rates and still high home prices).
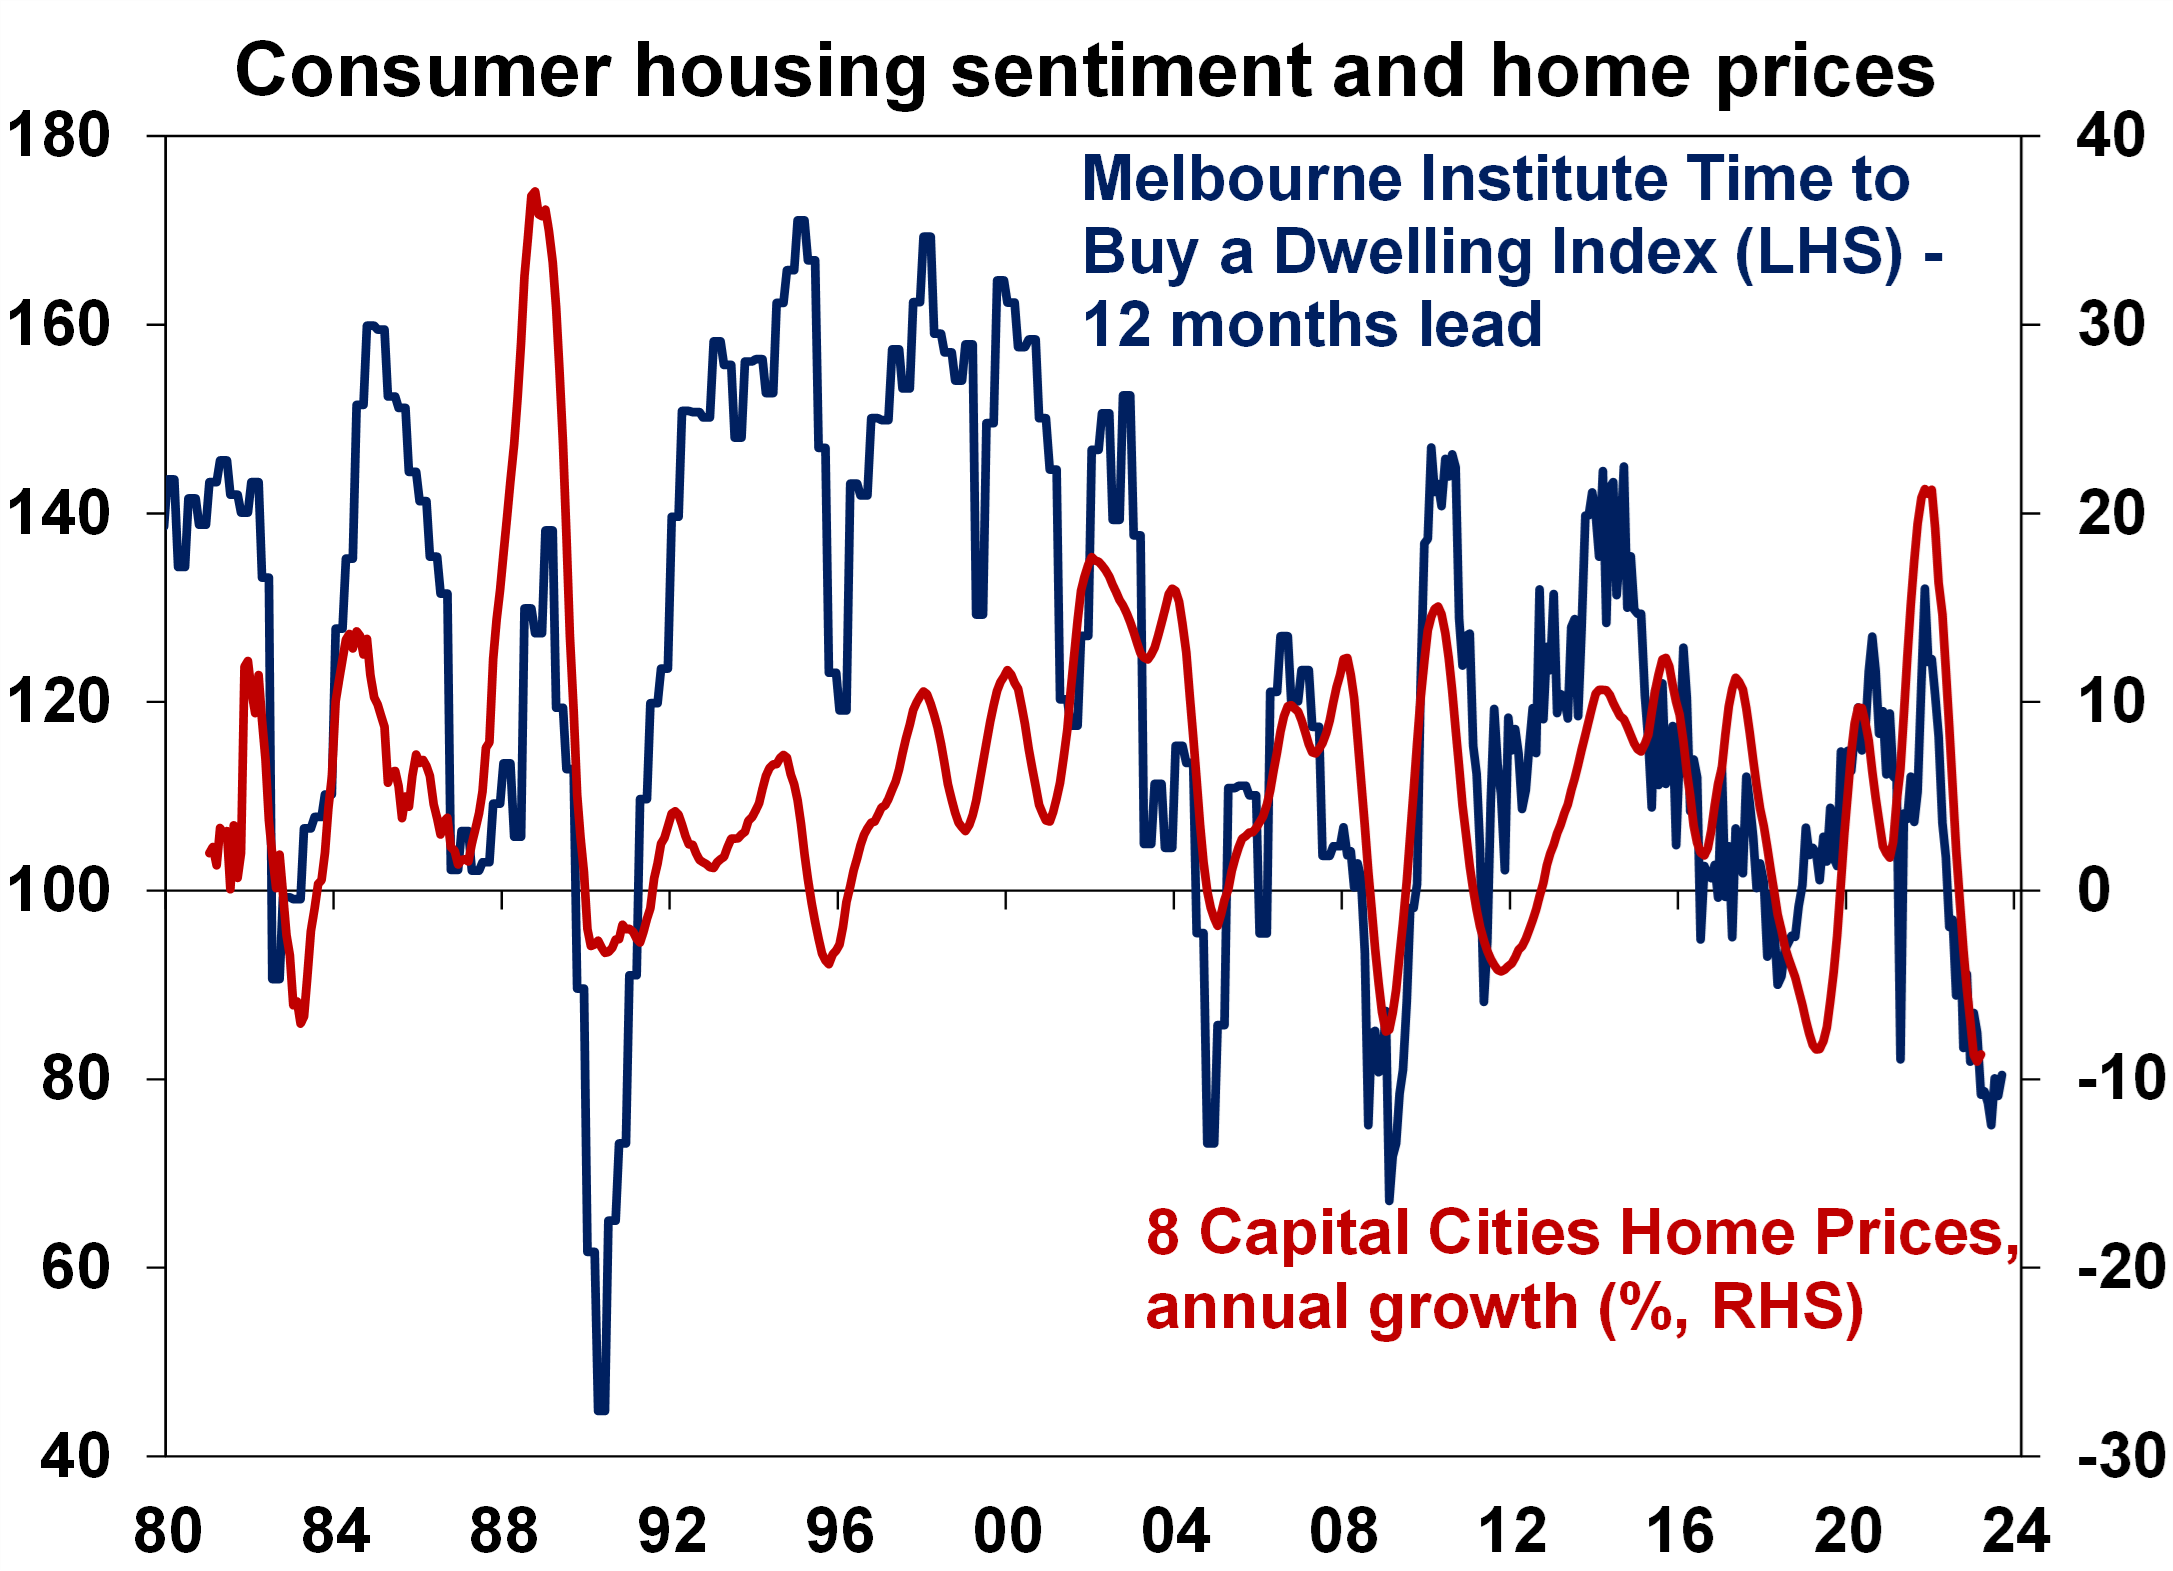
Source: CoreLogic, Westpac/MI, AMP
What to watch over the next week?
Business conditions PMIs for April for the US, Europe, Japan and Australia will be released on Friday and will be watched for a slowing in growth and further signs of easing inflation pressures.
US data in the week ahead is expected to show continuing weakness in manufacturing conditions in the New York and Philadelphia regions (Monday and Thursday), a further improvement in the home builders’ conditions index (Monday) but a fall in housing starts (Tuesday). US March quarter earnings reports will also start to flow – consensus expectations are for a -6%yoy but faster than normal downgrades in the last few months and stronger than expected economic growth and a fall in the $US point to some upside surprise.
Canadian CPI inflation (Tuesday) for March is expected to fall further.
Japanese inflation (Friday) for March is expected to fall to 3.2%yoy but with core (ex food and energy) rising further to 2.1%.
Chinese March quarter GDP is likely to show a sharp reopening driven boost with GDP rising 2.1%qoq or 3.8%yoy up from flat qoq and up 2.9%yoy in the December quarter. A further acceleration in industrial production, retail sales and fixed asset investment is likely in March.
In Australia, the minutes from the RBA’s last meeting (Tuesday) are likely to confirm that the RBA retains a tightening bias but is now data dependent with the focus to be on data for inflation, jobs, business conditions and household spending.
Media report also indicate that the independent review of the RBA will soon be released. Various reports suggest that it will recommend changes to the board to separate governance and rate setting, less meetings and more press conferences but no “substantial changes” to inflation targeting or any changes to RBA independence. Its unlikely to impact the short-term direction for monetary policy.
Outlook for investment markets
The next 6-12 months are likely to see easing inflation pressures, central banks moving to get off the brakes and economic growth weakening but stronger than feared. This along with improved valuations should make for better returns this year than in 2022. But will still be bumps on the way – particularly regarding interest rates, recession risks, geopolitical risks and raising the US debt ceiling in the September quarter.
Global shares are expected to see reasonable returns this year. The post mid-term election year normally results in above average gains in US shares, but US shares are likely to be a relative underperformer compared to non-US shares reflecting still higher price to earnings multiples versus non-US shares. The $US is also likely to weaken further which should benefit emerging and Asian shares.
Australian shares are likely to boosted by stronger economic growth than in other developed countries and stronger growth in China supporting commodity prices and as investors continue to like the grossed-up dividend yield of around 5.5%.
Bonds are likely to provide returns a bit above running yields, as inflation slows and central banks become less hawkish.
Unlisted commercial property and infrastructure are expected to see slower returns, reflecting the lagged impact of weaker share markets and last year’s rise in bond yields (on valuations). Commercial property returns are actually likely to be negative.
Our base case remains for Australian home prices to fall further out to later this year as interest rate hikes and slower economic growth impact, but the rapid return of immigration, very low rental vacancy rates and constrained supply mean that our expectation for a top to bottom fall of 15-20% may be too pessimistic and we may have already seen the low.
Cash and bank deposits are expected to provide returns of around 3.5%, reflecting the back up in interest rates.
A rising trend in the $A is likely over the next 12 months, reflecting a downtrend in the overvalued $US, the Fed moving to cut rates and solid commodity prices helped by stronger Chinese growth.
What you need to know
While every care has been taken in the preparation of this article, neither National Mutual Funds Management Ltd (ABN 32 006 787 720, AFSL 234652) (NMFM), AMP Limited ABN 49 079 354 519 nor any other member of the AMP Group (AMP) makes any representations or warranties as to the accuracy or completeness of any statement in it including, without limitation, any forecasts. Past performance is not a reliable indicator of future performance. This document has been prepared for the purpose of providing general information, without taking account of any particular investor’s objectives, financial situation or needs. An investor should, before making any investment decisions, consider the appropriateness of the information in this document, and seek professional advice, having regard to the investor’s objectives, financial situation and needs. This article is solely for the use of the party to whom it is provided and must not be provided to any other person or entity without the express written consent AMP. This article is not intended for distribution or use in any jurisdiction where it would be contrary to applicable laws, regulations or directives and does not constitute a recommendation, offer, solicitation or invitation to invest.